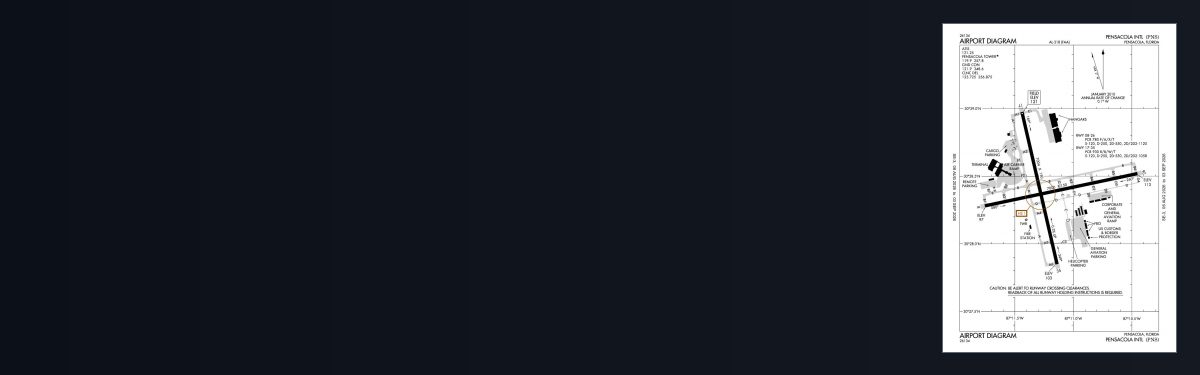
PENSACOLA, FL · 11 FAA charts · cycle 1 Oct 2026
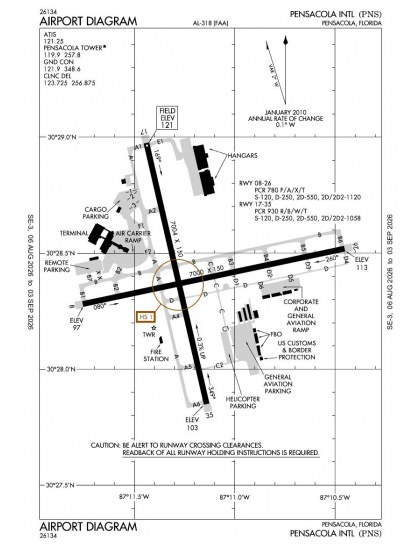
7 published instrument approaches: 1 ILS approach, 4 RNAV (GPS), 1 VOR, serving 4 runway ends.
| Chart | Amendment | ||
|---|---|---|---|
| ILS OR LOC RWY 17 | 14D | ||
| LOC RWY 26 | 1C | ||
| RNAV (GPS) RWY 08 | 2F | ||
| RNAV (GPS) RWY 17 | 2F | ||
| RNAV (GPS) RWY 26 | 2E | ||
| RNAV (GPS) RWY 35 | 2F | ||
| VOR RWY 08 | 4D |
| Chart | Amendment | ||
|---|---|---|---|
| TAKEOFF MINIMUMS | — | ||
| ALTERNATE MINIMUMS | — |
Minimums pages cover a whole volume, so the same document is shared by every airport in it.
| Chart | Amendment | ||
|---|---|---|---|
| HOT SPOT | — |
From the FAA NASR 28-day subscription, cycle 1 Oct 2026.
| Service | Frequency | Call sign |
|---|---|---|
| CTAF | 119.9 | |
| UNICOM | 122.95 | |
| Ground | 121.9 | Pensacola |
| Clearance delivery | 123.725 | Pensacola |
| ATIS | 121.25 | Pensacola |
| Approach | 118.6251-339119.0340-159124.05132.1 | Pensacola |
| Departure | 125.35 | Pensacola |
| Emergency | 121.5 | Pensacola |
Civil VHF frequencies from the FAA NASR 28-day subscription. Discrete sector and military frequencies are not listed.
| Runway | Length | Width | Surface | Lighting |
|---|---|---|---|---|
| 17/35 | 7,004 ft | 150 ft | Concrete Good | High intensity |
| 17 167°T | ILS/DME · PAPI (4-box) 3° · MALSR approach lighting | |||
| 35 347°T | PAPI (4-box) 3° | |||
| 08/26 | 7,000 ft | 150 ft | Asphalt Fair | High intensity |
| 08 78°T | PAPI (4-box) 3° | |||
| 26 258°T | LOC/DME · PAPI (4-box) 3° | |||
Runway and approach-aid data from the FAA NASR 28-day subscription.
30.4734170, -87.1866110
120 ft3 nm NEPaste the coordinates into a simulator’s world map to drop straight onto the field.
Published verbatim from the FAA NASR subscription. Abbreviations are the FAA's own.
Pensacola’s seven approach plates serve all four ends of its two similarly sized runways, so instrument coverage is not confined to one alignment. The mix spans RNAV (GPS), ILS, localiser and VOR procedures: satellite-based options form the largest group, while conventional procedures remain represented. At 7,000 ft and 7,004 ft, the runways are effectively equal in length; neither functions as an obviously shorter secondary strip.
Pensacola NAS has a substantially broader chart set nearby. Whiting Field NAS North and South and Hurlburt Field have coverage closer to Pensacola’s scale, while Peter Prince Field’s two-chart set is much thinner. The New Orleans Sectional adds regional VFR context, while the US Gulf Coast Helicopter Route Chart provides a specialised helicopter-routing view.
| ID | Airport | City | Distance | Charts |
|---|---|---|---|---|
| KNPA | Pensacola NAS (Forrest Sherman Fld) | PENSACOLA, FL | 10 nm SW | 23 |
| 2R4 | Peter Prince Fld | MILTON, FL | 14 nm NE | 2 |
| KNDZ | Whiting Fld NAS South | MILTON, FL | 16 nm NE | 8 |
| KNSE | Whiting Fld NAS North | MILTON, FL | 17 nm NE | 9 |
| KHRT | Hurlburt Fld | MARY ESTHER, FL | 26 nm E | 7 |
| 5R4 | Holk Fld At Foley Muni | FOLEY, AL | 27 nm W | 3 |
| KJKA | Gulf Shores Intl/Jack Edwards Fld | GULF SHORES, AL | 27 nm SW | 6 |
| KVPS | Eglin AFB/Destin-Ft Walton Beach | VALPARAISO/DESTIN-FT WALTON BEACH, FL | 34 nm E | 13 |
11 current FAA charts for Pensacola Intl, including 7 instrument approachs, 1 airport diagram. All are free to download as PDFs from this page, from the 1 October 2026 cycle.
Ground 121.9; ATIS 121.25; CTAF 119.9; UNICOM 122.95; Clearance delivery 123.725. Full civil VHF list, with sector notes, is in the frequencies table on this page — from the FAA NASR subscription.
Pensacola Intl has 2 runways. The longest is 17/35 at 7,004 ft by 150 ft, concrete. Full runway dimensions, lighting and approach aids are listed on this page.
Yes — 1 ILS procedure is published. In total KPNS has 7 published instrument approaches, of which 4 are RNAV (GPS).
The official FAA airport diagram for Pensacola Intl is free to download at the top of this page. It shows runways, taxiways, ramp layout and hold-short positions, and is reissued every 28 days.
Yes. Pensacola Intl has an operating control tower, within Jacksonville Center's airspace. Tower, ground and clearance frequencies are listed on this page.
They are from the FAA cycle effective 1 October 2026, which is superseded on 29 October 2026. We publish each new cycle on its effective date. They are for flight simulation and reference only — not for real-world navigation.

Flying into KPNS? PRO members take all 11 charts as one ZIP instead of 11 separate downloads, at full line speed with no cap — plus every chart family archive and all 24,000+ add-ons in the library.
Go PRO
Not for navigation. For flight simulation and reference use only. Procedures are superseded on a 28-day cycle — obtain current official charts from the FAA for real-world flight.
FAA public-domain products, mirrored unmodified. Fly Away Simulation is not affiliated with or endorsed by the FAA. Chart licensing and terms.

