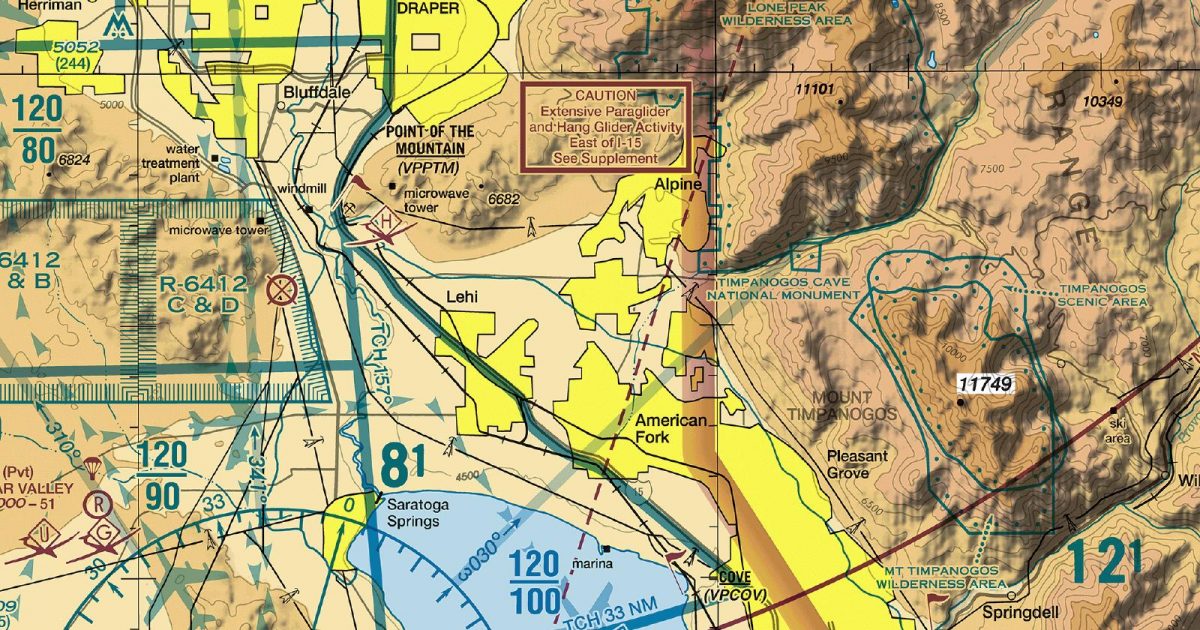
Official FAA digital chart — free GeoTIFF and PDF download
| Format | What you get | Size | |
|---|---|---|---|
| GeoTIFF | Georeferenced raster at 300 dpi, with world file and FGDC metadata | 29.7 MB | Download |
| Print-ready chart, no georeferencing | 59.7 MB | Download |
Not for navigation. For flight simulation and reference use only. Check the effective dates above, and obtain official charts from the FAA for real-world flight.

These are big files. This chart alone is 59.7 MB. Guest downloads are rate limited; PRO members get full-speed, unthrottled downloads across every chart and all 24,000+ add-ons in the library.
Go PROFrom Utah Lake north through the Salt Lake Valley and towards the Ogden area, this sheet follows northern Utah’s principal urban corridor along the Wasatch Front. It also reaches west across the Great Salt Lake and its dry basin margins, while extending east over the Wasatch Range towards the western Uinta country.
The result is a compact view of sharply contrasting terrain: broad valley floors and lake shores sit close to steep mountain ridges, confined canyons and higher country. That combination makes the chart particularly characteristic of flying around Salt Lake City, where metropolitan development occupies a narrow basin between major natural features.
The Terminal Area Chart presents this concentrated region at a closer scale suited to examining the Salt Lake City terminal area. The corresponding Sectional Aeronautical Chart places the same ground within a broader regional sheet, making it the more natural companion when a planned route continues beyond the Wasatch Front or needs wider geographical context.
| ID | Airport | City | Elev | Rwys | Longest |
|---|---|---|---|---|---|
| KSLC SLC | Salt Lake City Intl | SALT LAKE CITY, UT | 4,230 ft | 6 | 12,002 ft |
| KPVU PVU | Provo Muni | PROVO, UT | 4,496 ft | 2 | 8,603 ft |
| KOGD OGD | Ogden-Hinckley | OGDEN, UT | 4,472 ft | 2 | 8,107 ft |
| KEVW EVW | Evanston-Uinta County Burns Fld | EVANSTON, WY | 7,142 ft | 1 | 7,300 ft |
| KHCR HCR | Heber Valley | HEBER, UT | 5,636 ft | 1 | 6,898 ft |
| KSPK SPK | Spanish Fork Muni/Woodhouse Fld | SPANISH FORK, UT | 4,529 ft | 1 | 6,500 ft |
| KTVY TVY | Bolinder Fld/Tooele Valley | TOOELE, UT | 4,321 ft | 1 | 6,102 ft |
| KSVR SVR | South Valley Rgnl | SALT LAKE CITY, UT | 4,606 ft | 1 | 5,862 ft |
| UT9 | West Desert Airpark | FAIRFIELD, UT | 4,886 ft | 1 | 5,200 ft |
| KBTF BTF | Skypark | BOUNTIFUL, UT | 4,237 ft | 1 | 4,634 ft |
| 42U | Morgan County | MORGAN, UT | 5,020 ft | 1 | 3,904 ft |
| 2UT | Fremont Island Upper | HOOPER, UT | 4,654 ft | 1 | 1,980 ft |
| 1UT | Fremont Island Lower | HOOPER, UT | 4,234 ft | 1 | 1,843 ft |
13 public-use airports within this chart's coverage, ordered by runway length. A further 9 private and restricted landing facilities are not listed. Source: FAA NASR 28-day subscription.
Approach plates and airport diagrams for every airport in the states this sheet covers:
It spans 40.0°N to 41.5°N and 113.3°W to 111.0°W. Airports on the sheet fall within Utah and Wyoming. The full list of public-use airports within its coverage is on this page.
Take the GeoTIFF if you are loading the chart into moving-map software or a flight planner — it is georeferenced, so the software can place it correctly on a map, and it ships with a world file and FGDC metadata at 300 dpi (29.7 MB). Take the PDF to print it or read it on a second screen (59.7 MB); it is the same chart without georeferencing.
This is the FAA edition effective 3 September 2026, which is superseded on 29 October 2026. Visual charts are reissued every 56 days and we publish each new edition on the day it takes effect. It is for flight simulation and reference only — not for real-world navigation.
Yes, with no account required. FAA charts are United States Government works and are not subject to copyright protection in the US under 17 U.S.C. § 105. Guest downloads are speed-capped, so a sheet this size takes a while; PRO members download at full line speed and can take the whole family as one archive.

FAA public-domain products, mirrored unmodified. Fly Away Simulation is not affiliated with or endorsed by the FAA. Chart licensing and terms.

