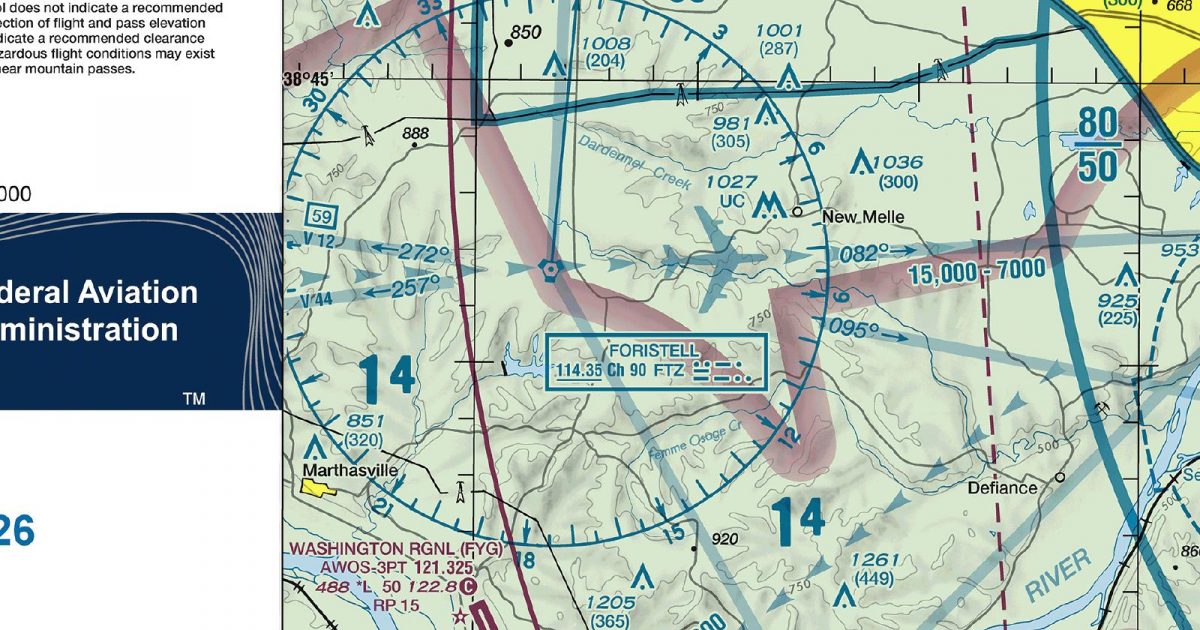
Official FAA digital chart — free GeoTIFF and PDF download
| Format | What you get | Size | |
|---|---|---|---|
| GeoTIFF | Georeferenced raster at 300 dpi, with world file and FGDC metadata | 19.0 MB | Download |
| Print-ready chart, no georeferencing | 39.6 MB | Download |
Not for navigation. For flight simulation and reference use only. Check the effective dates above, and obtain official charts from the FAA for real-world flight.

These are big files. This chart alone is 39.6 MB. Guest downloads are rate limited; PRO members get full-speed, unthrottled downloads across every chart and all 24,000+ add-ons in the library.
Go PROCentred on metropolitan St Louis, this sheet spans both sides of the Mississippi, from eastern Missouri into south-western Illinois. Its coverage includes the broad lowlands around the meeting of the Missouri and Mississippi, with the Illinois joining nearby, then reaches west across rolling Missouri country and east across the flatter Illinois side. The result is a compact view of an urban region shaped by major rivers, wooded ridges, floodplains, dense development and surrounding agricultural ground.
The Terminal Area Chart keeps greater St Louis at the centre and presents the metropolitan area at a larger scale than the Sectional Aeronautical Chart covering the same ground. It is the more focused choice for planning or recreating flights within and immediately around the city. The sectional is better suited to routes continuing beyond this footprint, where wider regional continuity matters more than close metropolitan presentation. Together, the products connect local-area detail with the broader Missouri–Illinois setting.
| ID | Airport | City | Elev | Rwys | Longest |
|---|---|---|---|---|---|
| KSTL STL | St Louis Lambert Intl | ST LOUIS, MO | 617 ft | 4 | 11,020 ft |
| KBLV BLV | Scott AFB/Midamerica St Louis | BELLEVILLE, IL | 459 ft | 2 | 10,000 ft |
| KALN ALN | St Louis Rgnl | ALTON/ST LOUIS, IL | 543 ft | 2 | 8,099 ft |
| KSUS SUS | Spirit Of St Louis | ST LOUIS, MO | 463 ft | 2 | 7,486 ft |
| KCPS CPS | St Louis Downtown | CAHOKIA/ST LOUIS, IL | 412 ft | 3 | 7,002 ft |
| KFYG FYG | Washington Rgnl | WASHINGTON, MO | 487 ft | 1 | 5,002 ft |
| 1H0 | Creve Coeur | ST LOUIS, MO | 462 ft | 2 | 4,500 ft |
| KUUV UUV | Sullivan Rgnl | SULLIVAN, MO | 933 ft | 1 | 4,500 ft |
| 3LF | Litchfield Muni | LITCHFIELD, IL | 690 ft | 2 | 4,002 ft |
| KSAR SAR | Sparta Community-Hunter Fld | SPARTA, IL | 537 ft | 2 | 4,002 ft |
| KSET SET | St Charles County Rgnl/Smartt Fld | ST CHARLES, MO | 436 ft | 2 | 3,800 ft |
| M71 | Greensfield | MOSCOW MILLS, MO | 559 ft | 1 | 3,227 ft |
| H07 | Highland-Winet | HIGHLAND, IL | 537 ft | 1 | 2,200 ft |
13 public-use airports within this chart's coverage, ordered by runway length. A further 55 private and restricted landing facilities are not listed. Source: FAA NASR 28-day subscription.
Approach plates and airport diagrams for every airport in the states this sheet covers:
It spans 38.1°N to 39.3°N and 91.5°W to 89.5°W. Airports on the sheet fall within Illinois and Missouri. The full list of public-use airports within its coverage is on this page.
Take the GeoTIFF if you are loading the chart into moving-map software or a flight planner — it is georeferenced, so the software can place it correctly on a map, and it ships with a world file and FGDC metadata at 300 dpi (19.0 MB). Take the PDF to print it or read it on a second screen (39.6 MB); it is the same chart without georeferencing.
This is the FAA edition effective 3 September 2026, which is superseded on 29 October 2026. Visual charts are reissued every 56 days and we publish each new edition on the day it takes effect. It is for flight simulation and reference only — not for real-world navigation.
Yes, with no account required. FAA charts are United States Government works and are not subject to copyright protection in the US under 17 U.S.C. § 105. Guest downloads are speed-capped, so a sheet this size takes a while; PRO members download at full line speed and can take the whole family as one archive.

FAA public-domain products, mirrored unmodified. Fly Away Simulation is not affiliated with or endorsed by the FAA. Chart licensing and terms.

