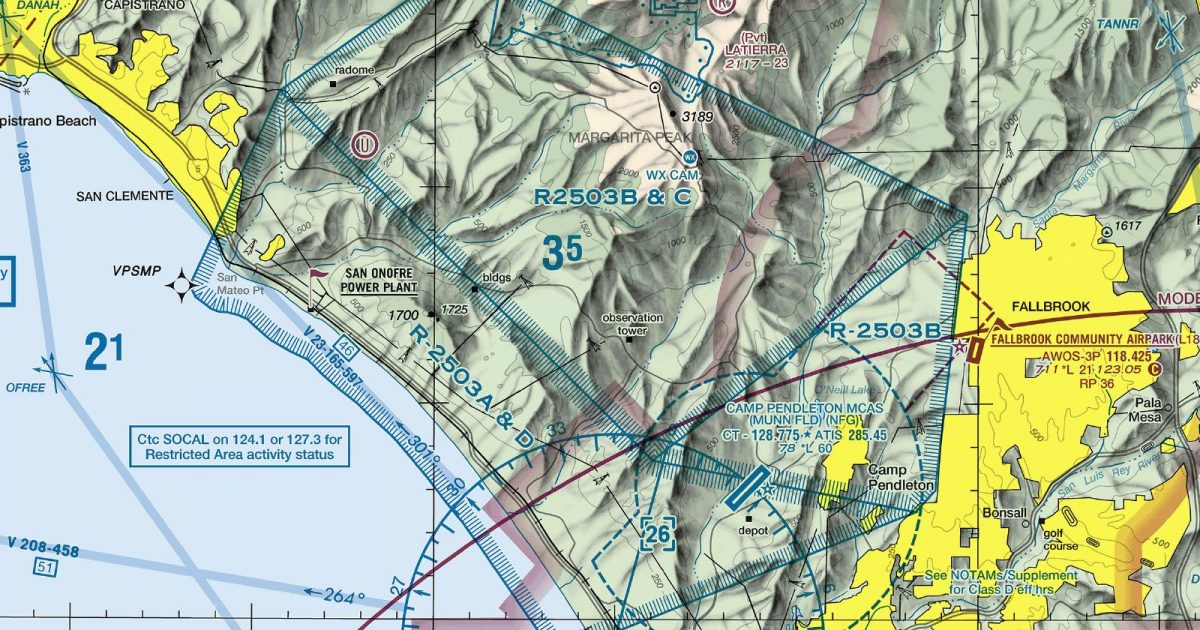
Official FAA digital chart — free GeoTIFF and PDF download
| Format | What you get | Size | |
|---|---|---|---|
| GeoTIFF | Georeferenced raster at 300 dpi, with world file and FGDC metadata | 26.5 MB | Download |
| Print-ready chart, no georeferencing | 51.6 MB | Download |
Not for navigation. For flight simulation and reference use only. Check the effective dates above, and obtain official charts from the FAA for real-world flight.

These are big files. This chart alone is 51.6 MB. Guest downloads are rate limited; PRO members get full-speed, unthrottled downloads across every chart and all 24,000+ add-ons in the library.
Go PROSan Diego’s shoreline, the international border at Tijuana and the desert around the Salton Sea all fall within this terminal-area view. Coverage extends offshore into the Pacific, north along the coast into southern Orange County, and east across San Diego County to the Imperial Valley.
The result is a sharp west-to-east contrast: coastal urban development gives way to ridges, valleys and the higher ground of the Peninsular Ranges before descending into broad, arid desert. The sheet also includes part of northern Baja California, placing the border region in its immediate geographical context.
At the north-western side, the chart adjoins the Los Angeles Terminal Area Chart. That relationship provides continuity where the heavily developed Southern California coast connects the San Diego region with the wider Los Angeles basin, while the inland portion remains dominated by mountain and desert terrain.
| ID | Airport | City | Elev | Rwys | Longest |
|---|---|---|---|---|---|
| KSAN SAN | San Diego Intl | SAN DIEGO, CA | 16 ft | 1 | 9,401 ft |
| KTRM TRM | Jacqueline Cochran Rgnl | PALM SPRINGS, CA | -114 ft | 2 | 8,500 ft |
| KSDM SDM | Brown Fld Muni | SAN DIEGO, CA | 526 ft | 2 | 7,972 ft |
| F70 | French Valley | MURRIETA/TEMECULA, CA | 1,349 ft | 1 | 6,000 ft |
| L04 | Holtville | HOLTVILLE, CA | 59 ft | 1 | 6,000 ft |
| KSEE SEE | Gillespie Fld | SAN DIEGO/EL CAJON, CA | 387 ft | 3 | 5,342 ft |
| KIPL IPL | Imperial County | IMPERIAL, CA | -53 ft | 2 | 5,308 ft |
| L08 | Borrego Valley | BORREGO SPRINGS, CA | 522 ft | 1 | 5,011 ft |
| KRNM RNM | Ramona | RAMONA, CA | 1,394 ft | 2 | 5,001 ft |
| KSAS SAS | Salton Sea | SALTON CITY, CA | -84 ft | 1 | 5,000 ft |
| KCRQ CRQ | Mc Clellan-Palomar | CARLSBAD, CA | 330 ft | 2 | 4,897 ft |
| KCXL CXL | Calexico Intl | CALEXICO, CA | 5 ft | 1 | 4,683 ft |
| KMYF MYF | Montgomery-Gibbs Exec | SAN DIEGO, CA | 427 ft | 4 | 4,598 ft |
| L90 | Ocotillo | OCOTILLO WELLS, CA | 160 ft | 2 | 4,210 ft |
| KBWC BWC | Brawley Muni | BRAWLEY, CA | -127 ft | 1 | 4,166 ft |
| KCLR CLR | Cliff Hatfield Meml | CALIPATRIA, CA | -181 ft | 1 | 3,423 ft |
| KOKB OKB | Bob Maxwell Meml Airfield | OCEANSIDE, CA | 28 ft | 1 | 2,712 ft |
| L78 | Jacumba | JACUMBA, CA | 2,844 ft | 1 | 2,562 ft |
| L18 | Fallbrook Community Airpark | FALLBROOK, CA | 710 ft | 2 | 2,150 ft |
19 public-use airports within this chart's coverage, ordered by runway length. A further 26 private and restricted landing facilities are not listed. Source: FAA NASR 28-day subscription.
Approach plates and airport diagrams for every airport in the states this sheet covers:
It spans 32.4°N to 33.7°N and 118.1°W to 115.2°W. Airports on the sheet fall within California. The full list of public-use airports within its coverage is on this page.
Take the GeoTIFF if you are loading the chart into moving-map software or a flight planner — it is georeferenced, so the software can place it correctly on a map, and it ships with a world file and FGDC metadata at 300 dpi (26.5 MB). Take the PDF to print it or read it on a second screen (51.6 MB); it is the same chart without georeferencing.
This is the FAA edition effective 3 September 2026, which is superseded on 29 October 2026. Visual charts are reissued every 56 days and we publish each new edition on the day it takes effect. It is for flight simulation and reference only — not for real-world navigation.
Los Angeles to the north-west. Each is linked from this page, so a route running off one edge can be continued on the next sheet.
Yes, with no account required. FAA charts are United States Government works and are not subject to copyright protection in the US under 17 U.S.C. § 105. Guest downloads are speed-capped, so a sheet this size takes a while; PRO members download at full line speed and can take the whole family as one archive.

FAA public-domain products, mirrored unmodified. Fly Away Simulation is not affiliated with or endorsed by the FAA. Chart licensing and terms.

