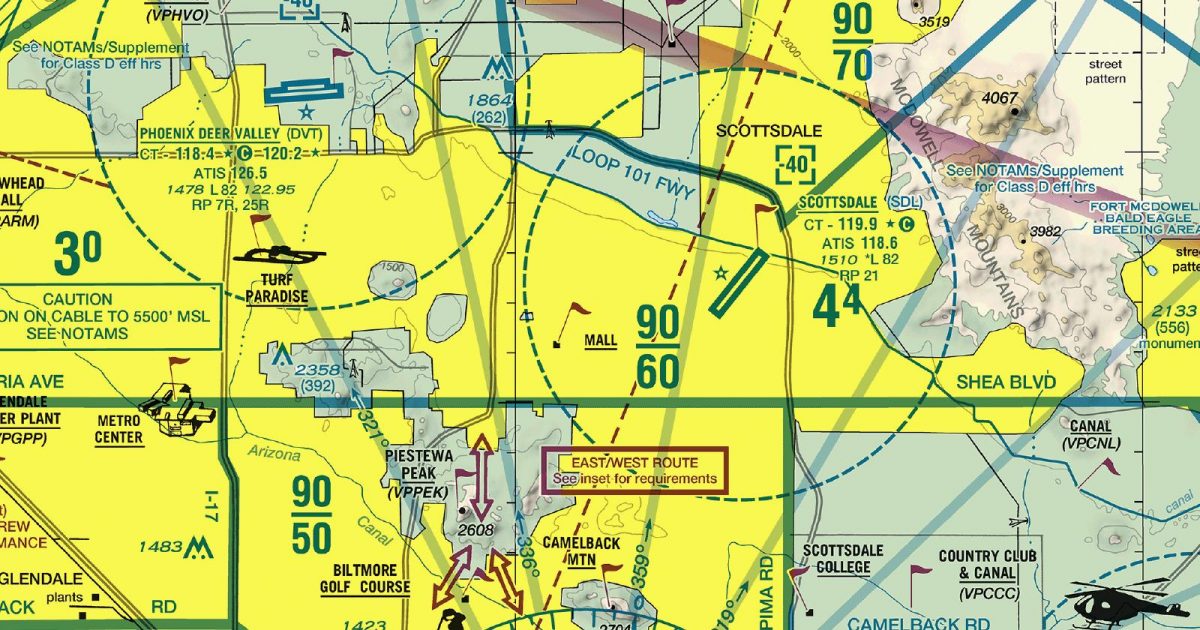
Official FAA digital chart — free GeoTIFF and PDF download
| Format | What you get | Size | |
|---|---|---|---|
| GeoTIFF | Georeferenced raster at 300 dpi, with world file and FGDC metadata | 27.8 MB | Download |
| Print-ready chart, no georeferencing | 55.5 MB | Download |
Not for navigation. For flight simulation and reference use only. Check the effective dates above, and obtain official charts from the FAA for real-world flight.

These are big files. This chart alone is 55.5 MB. Guest downloads are rate limited; PRO members get full-speed, unthrottled downloads across every chart and all 24,000+ add-ons in the library.
Go PROPhoenix’s broad urban basin occupies the centre of this sheet, framed by the rugged desert ranges of central and southern Arizona. Coverage reaches west across the lower Gila country beyond Gila Bend, north towards Wickenburg and the foothills of the Bradshaw Mountains, east to the Superstition Mountains, and south past Casa Grande towards Picacho Peak.
The landscape alternates between extensive low desert, irrigated valleys, dense development and sharply rising isolated ranges. That contrast makes the chart particularly useful for simulator routes crossing the Phoenix metropolitan area or moving between the open Sonoran Desert and the higher ground to the north and east.
The Terminal Area Chart presents the Phoenix area at a larger scale, giving more room to the concentrated aeronautical detail around the city and its immediate approaches. The Sectional Aeronautical Chart covering the same region places Phoenix within a much broader Arizona context, making it better suited to planning longer routes beyond the terminal area.
| ID | Airport | City | Elev | Rwys | Longest |
|---|---|---|---|---|---|
| KPHX PHX | Phoenix Sky Harbor Intl | PHOENIX, AZ | 1,134 ft | 3 | 11,489 ft |
| KIWA IWA | Mesa Gateway | PHOENIX, AZ | 1,384 ft | 3 | 10,401 ft |
| KGYR GYR | Phoenix Goodyear | GOODYEAR, AZ | 969 ft | 2 | 8,500 ft |
| KSDL SDL | Scottsdale | SCOTTSDALE, AZ | 1,510 ft | 1 | 8,249 ft |
| KDVT DVT | Phoenix Deer Valley | PHOENIX, AZ | 1,478 ft | 2 | 8,196 ft |
| KGEU GEU | Glendale Rgnl | GLENDALE, AZ | 1,071 ft | 1 | 7,150 ft |
| E25 | Wickenburg Muni | WICKENBURG, AZ | 2,378 ft | 1 | 6,101 ft |
| P08 | Coolidge Muni | COOLIDGE, AZ | 1,576 ft | 2 | 5,564 ft |
| KBXK BXK | Buckeye Muni | BUCKEYE, AZ | 1,033 ft | 1 | 5,500 ft |
| KCGZ CGZ | Casa Grande Muni | CASA GRANDE, AZ | 1,464 ft | 1 | 5,200 ft |
| E63 | Gila Bend Muni | GILA BEND, AZ | 788 ft | 1 | 5,200 ft |
| KFFZ FFZ | Falcon Fld | MESA, AZ | 1,394 ft | 2 | 5,100 ft |
| KCHD CHD | Chandler Muni | CHANDLER, AZ | 1,243 ft | 3 | 4,870 ft |
| A39 | Ak-Chin Rgnl | MARICOPA, AZ | 1,307 ft | 1 | 4,751 ft |
| P19 | Stellar Airpark | CHANDLER, AZ | 1,178 ft | 1 | 4,417 ft |
| E60 | Eloy Muni | ELOY, AZ | 1,511 ft | 1 | 3,901 ft |
16 public-use airports within this chart's coverage, ordered by runway length. A further 37 private and restricted landing facilities are not listed. Source: FAA NASR 28-day subscription.
Approach plates and airport diagrams for every airport in the states this sheet covers:
It spans 32.6°N to 34.1°N and 113.6°W to 111.2°W. Airports on the sheet fall within Arizona. The full list of public-use airports within its coverage is on this page.
Take the GeoTIFF if you are loading the chart into moving-map software or a flight planner — it is georeferenced, so the software can place it correctly on a map, and it ships with a world file and FGDC metadata at 300 dpi (27.8 MB). Take the PDF to print it or read it on a second screen (55.5 MB); it is the same chart without georeferencing.
This is the FAA edition effective 3 September 2026, which is superseded on 29 October 2026. Visual charts are reissued every 56 days and we publish each new edition on the day it takes effect. It is for flight simulation and reference only — not for real-world navigation.
Yes, with no account required. FAA charts are United States Government works and are not subject to copyright protection in the US under 17 U.S.C. § 105. Guest downloads are speed-capped, so a sheet this size takes a while; PRO members download at full line speed and can take the whole family as one archive.

FAA public-domain products, mirrored unmodified. Fly Away Simulation is not affiliated with or endorsed by the FAA. Chart licensing and terms.

