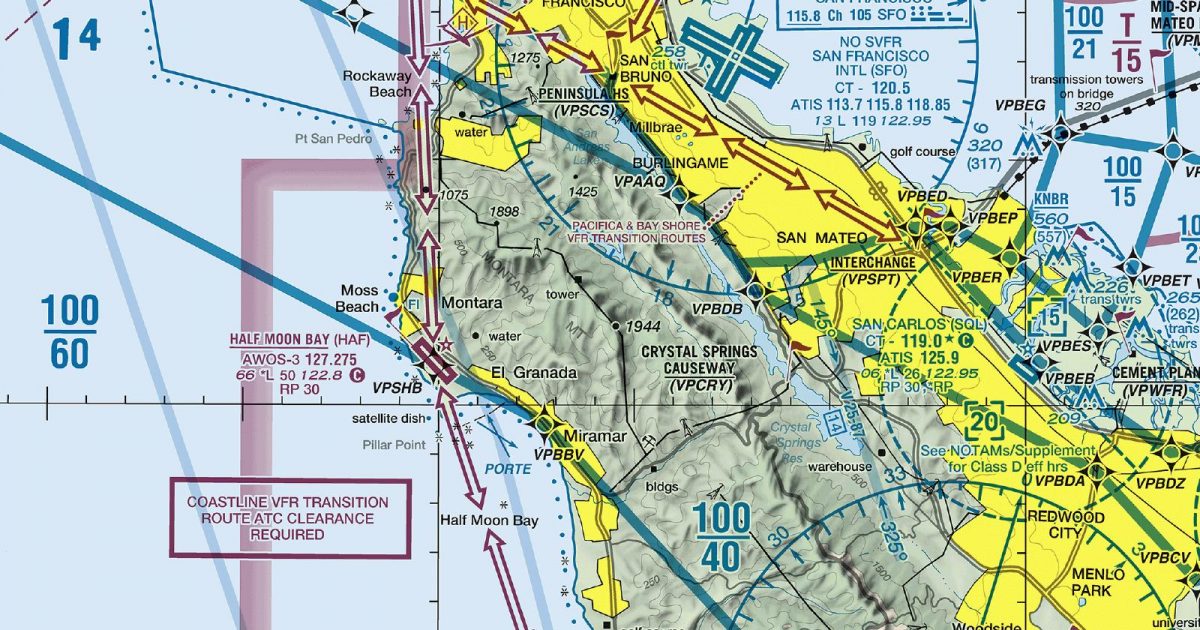
Official FAA digital chart — free GeoTIFF and PDF download
| Format | What you get | Size | |
|---|---|---|---|
| GeoTIFF | Georeferenced raster at 300 dpi, with world file and FGDC metadata | 30.3 MB | Download |
| Print-ready chart, no georeferencing | 60.4 MB | Download |
Not for navigation. For flight simulation and reference use only. Check the effective dates above, and obtain official charts from the FAA for real-world flight.

These are big files. This chart alone is 60.4 MB. Guest downloads are rate limited; PRO members get full-speed, unthrottled downloads across every chart and all 24,000+ add-ons in the library.
Go PROFrom the Pacific beyond Point Reyes to the western Central Valley, this chart centres on San Francisco Bay and its varied surroundings. Coverage extends south across the Santa Cruz Mountains to Monterey Bay, while the eastern portion reaches beyond the East Bay hills towards the flatter inland country.
The result is a compact but geographically diverse area: open coastline, the enclosed waters and shorelines of the Bay, densely developed urban ground, and several prominent ridge systems. Coastal routes meet abrupt headlands and rising terrain, while inland journeys cross the Diablo Range before reaching the Central Valley. That contrast makes the sheet particularly useful for simulator flights built around transitions between maritime, metropolitan and inland landscapes.
The Terminal Area Chart presents the Bay Area at a larger scale, keeping this complex metropolitan region readable within a single focused sheet. The corresponding Sectional Aeronautical Chart covers the same place as part of a broader regional view, making it better suited to routes that continue well beyond the immediate Bay Area. Used together, the terminal chart supplies the close view and the sectional provides surrounding context.
| ID | Airport | City | Elev | Rwys | Longest |
|---|---|---|---|---|---|
| KSFO SFO | San Francisco Intl | SAN FRANCISCO, CA | 13 ft | 4 | 11,870 ft |
| KSJC SJC | Mineta San Jose Intl | SAN JOSE, CA | 62 ft | 2 | 11,000 ft |
| KOAK OAK | Oakland San Francisco Bay | OAKLAND, CA | 9 ft | 4 | 10,520 ft |
| KAPC APC | Napa County | NAPA, CA | 35 ft | 3 | 5,930 ft |
| KHWD HWD | Hayward Exec | HAYWARD, CA | 52 ft | 2 | 5,694 ft |
| KLVK LVK | Livermore Muni | LIVERMORE, CA | 399 ft | 3 | 5,253 ft |
| KCCR CCR | Buchanan Fld | CONCORD, CA | 25 ft | 4 | 5,001 ft |
| KHAF HAF | Half Moon Bay | HALF MOON BAY, CA | 66 ft | 1 | 5,000 ft |
| C83 | Byron | BYRON, CA | 78 ft | 2 | 4,500 ft |
| O88 | Rio Vista Muni | RIO VISTA, CA | 22 ft | 3 | 4,199 ft |
| KTCY TCY | Tracy Muni | TRACY, CA | 193 ft | 2 | 4,001 ft |
| O20 | Kingdon Airpark | LODI, CA | 18 ft | 1 | 3,851 ft |
| O69 | Petaluma Muni | PETALUMA, CA | 90 ft | 1 | 3,600 ft |
| KDVO DVO | Gnoss Fld | NOVATO, CA | 4 ft | 2 | 3,303 ft |
| F72 | Franklin Fld | FRANKLIN, CA | 23 ft | 2 | 3,123 ft |
| KRHV RHV | Reid-Hillview Of Santa Clara County | SAN JOSE, CA | 135 ft | 2 | 3,100 ft |
| E16 | San Martin | SAN MARTIN, CA | 283 ft | 1 | 3,095 ft |
| 1C9 | Frazier Lake Airpark | HOLLISTER, CA | 152 ft | 2 | 3,000 ft |
| 0Q3 | Sonoma Valley | SCHELLVILLE/SONOMA, CA | 16 ft | 2 | 2,700 ft |
| KSQL SQL | San Carlos | SAN CARLOS, CA | 5 ft | 1 | 2,621 ft |
| 0Q9 | Sonoma Skypark | SONOMA, CA | 28 ft | 1 | 2,490 ft |
| KPAO PAO | Palo Alto | PALO ALTO, CA | 6 ft | 1 | 2,441 ft |
| L53 | Lodi Airpark | LODI, CA | 25 ft | 1 | 1,875 ft |
23 public-use airports within this chart's coverage, ordered by runway length. A further 11 private and restricted landing facilities are not listed. Source: FAA NASR 28-day subscription.
Approach plates and airport diagrams for every airport in the states this sheet covers:
It spans 37.0°N to 38.3°N and 123.9°W to 121.3°W. Airports on the sheet fall within California. The full list of public-use airports within its coverage is on this page.
Take the GeoTIFF if you are loading the chart into moving-map software or a flight planner — it is georeferenced, so the software can place it correctly on a map, and it ships with a world file and FGDC metadata at 300 dpi (30.3 MB). Take the PDF to print it or read it on a second screen (60.4 MB); it is the same chart without georeferencing.
This is the FAA edition effective 3 September 2026, which is superseded on 29 October 2026. Visual charts are reissued every 56 days and we publish each new edition on the day it takes effect. It is for flight simulation and reference only — not for real-world navigation.
Yes, with no account required. FAA charts are United States Government works and are not subject to copyright protection in the US under 17 U.S.C. § 105. Guest downloads are speed-capped, so a sheet this size takes a while; PRO members download at full line speed and can take the whole family as one archive.

FAA public-domain products, mirrored unmodified. Fly Away Simulation is not affiliated with or endorsed by the FAA. Chart licensing and terms.

