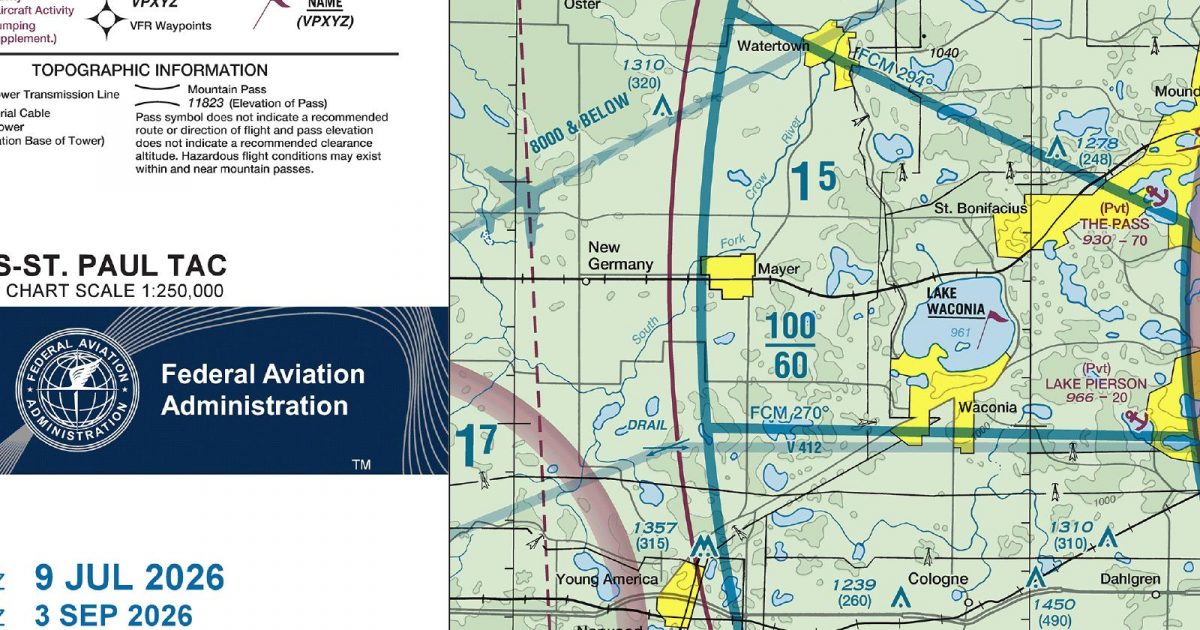
Official FAA digital chart — free GeoTIFF and PDF download
| Format | What you get | Size | |
|---|---|---|---|
| GeoTIFF | Georeferenced raster at 300 dpi, with world file and FGDC metadata | 13.2 MB | Download |
| Print-ready chart, no georeferencing | 26.6 MB | Download |
Not for navigation. For flight simulation and reference use only. Check the effective dates above, and obtain official charts from the FAA for real-world flight.

These are big files. This chart alone is 26.6 MB. Guest downloads are rate limited; PRO members get full-speed, unthrottled downloads across every chart and all 24,000+ add-ons in the library.
Go PROMinneapolis and Saint Paul anchor a sheet spanning both sides of the Minnesota–Wisconsin border. It reaches west beyond Hutchinson, east across the St Croix into western Wisconsin, north towards St Cloud and south beyond Red Wing. The coverage takes in the metropolitan core together with a broad ring of smaller communities, farmland and lake country.
The Mississippi, Minnesota and St Croix river corridors give the area its clearest large-scale geographical structure. Around the conurbation, dense development and connected suburbs sit among numerous lakes; farther out, the view opens into glaciated plains, rolling agricultural ground and patches of woodland. Western Wisconsin becomes more wooded and broken by valleys, while the country to the west and south-west is generally more open. A crossing of the sheet can therefore move quickly from a major urban area to river scenery, lake-studded terrain and rural Upper Midwest landscapes while remaining within the immediate Twin Cities region.
| ID | Airport | City | Elev | Rwys | Longest |
|---|---|---|---|---|---|
| KMSP MSP | Minneapolis-St Paul Intl/Wold-Chamberlain | MINNEAPOLIS, MN | 841 ft | 4 | 11,006 ft |
| KRPD RPD | Rice Lake Rgnl/Carl'S Fld | RICE LAKE, WI | 1,109 ft | 2 | 6,700 ft |
| KSTP STP | St Paul Downtown Holman Fld | ST PAUL, MN | 705 ft | 3 | 6,491 ft |
| KRNH RNH | New Richmond Rgnl | NEW RICHMOND, WI | 997 ft | 3 | 5,507 ft |
| KLUM LUM | Menomonie Muni/Score Fld | MENOMONIE, WI | 895 ft | 2 | 5,074 ft |
| KRGK RGK | Red Wing Rgnl | RED WING, MN | 778 ft | 1 | 5,010 ft |
| KOEO OEO | L O Simenstad Muni | OSCEOLA, WI | 905 ft | 2 | 5,006 ft |
| KFCM FCM | Flying Cloud | MINNEAPOLIS, MN | 906 ft | 3 | 5,001 ft |
| KANE ANE | Anoka County/Blaine (Janes Fld) | MINNEAPOLIS, MN | 912 ft | 2 | 5,000 ft |
| KFBL FBL | Faribault Muni-Liz Wall Strohfus Fld | FARIBAULT, MN | 1,060 ft | 2 | 4,257 ft |
| KLVN LVN | Airlake | MINNEAPOLIS, MN | 960 ft | 1 | 4,099 ft |
| KAHH AHH | Amery Muni | AMERY, WI | 1,088 ft | 1 | 4,002 ft |
| KSGS SGS | South St Paul Muni/Richard E Fleming Fld | SOUTH ST PAUL, MN | 821 ft | 1 | 4,002 ft |
| KHCD HCD | Hutchinson Muni/Butler Fld | HUTCHINSON, MN | 1,062 ft | 1 | 4,000 ft |
| KMIC MIC | Crystal | MINNEAPOLIS, MN | 869 ft | 3 | 3,751 ft |
| 21D | Lake Elmo | ST PAUL, MN | 932 ft | 2 | 3,504 ft |
| Y23 | Chetek Muni/Southworth | CHETEK, WI | 1,056 ft | 2 | 3,401 ft |
| KGYL GYL | Glencoe Muni | GLENCOE, MN | 992 ft | 1 | 3,300 ft |
| 3T3 | Boyceville Muni | BOYCEVILLE, WI | 967 ft | 1 | 3,299 ft |
| 10D | Winsted Muni | WINSTED, MN | 1,030 ft | 1 | 3,248 ft |
| KCFE CFE | Buffalo Muni | BUFFALO, MN | 967 ft | 1 | 3,200 ft |
| 25D | Forest Lake | FOREST LAKE, MN | 931 ft | 1 | 3,000 ft |
| 12Y | Le Sueur Muni | LE SUEUR, MN | 867 ft | 1 | 3,000 ft |
| 8Y6 | Leaders Clear Lake | CLEAR LAKE, MN | 990 ft | 1 | 3,000 ft |
| KMGG MGG | Maple Lake Muni-Bill Mavencamp Sr Fld | MAPLE LAKE, MN | 1,028 ft | 1 | 2,796 ft |
| KSYN SYN | Stanton Airfield | STANTON, MN | 920 ft | 2 | 2,582 ft |
| 9Y7 | Barron Muni | BARRON, WI | 1,110 ft | 1 | 2,010 ft |
27 public-use airports within this chart's coverage, ordered by runway length. A further 66 private and restricted landing facilities are not listed. Source: FAA NASR 28-day subscription.
Approach plates and airport diagrams for every airport in the states this sheet covers:
It spans 44.3°N to 45.5°N and 94.5°W to 91.6°W. Airports on the sheet fall within Minnesota and Wisconsin. The full list of public-use airports within its coverage is on this page.
Take the GeoTIFF if you are loading the chart into moving-map software or a flight planner — it is georeferenced, so the software can place it correctly on a map, and it ships with a world file and FGDC metadata at 300 dpi (13.2 MB). Take the PDF to print it or read it on a second screen (26.6 MB); it is the same chart without georeferencing.
This is the FAA edition effective 3 September 2026, which is superseded on 29 October 2026. Visual charts are reissued every 56 days and we publish each new edition on the day it takes effect. It is for flight simulation and reference only — not for real-world navigation.
Yes, with no account required. FAA charts are United States Government works and are not subject to copyright protection in the US under 17 U.S.C. § 105. Guest downloads are speed-capped, so a sheet this size takes a while; PRO members download at full line speed and can take the whole family as one archive.

FAA public-domain products, mirrored unmodified. Fly Away Simulation is not affiliated with or endorsed by the FAA. Chart licensing and terms.

